Day 18: Time and Recurrence Math - When Calendars Attack Your Data
Don't let messy calendars and hidden time patterns derail your analysis. Learn to master recurrence math and compare time-based data with confidence.
Comparing monthly or weekly data seems simple, but unequal periods and shifting patterns can lead to misleading conclusions. This guide provides the Python code and concepts to handle time series data correctly.
The Innocent Question That Breaks Everything
Your boss asks: "Track our weekly sales. Compare this month vs last month."
You think: "Easy! Just sum up the sales!"
Reality: Time is messy, calendars are inconsistent, and recurrence patterns hide traps!
Show code (9 lines)
February: 4 weeks (28 days) = 4 data points
March: 4.43 weeks (31 days) = 4-5 data points
Which is it? 4 or 5?

February sales: $400K (4 weeks)
March sales: $500K (5 weeks)

Is March better? Or just 25% longer?
What is Recurrence?
Recurrence = Events that repeat on a schedule. Understanding these patterns is the first step to taming your time series data.
The Calendar Reality Check
Direct comparisons between months, weeks, or quarters are often flawed because these periods are not equal.
Months Are NOT Equal
Months vary from 28 to 31 days—a 10.7% variation in length! February is consistently the outlier, making direct comparisons with January or March misleading.
Weeks Don't Fit in Months
A month contains, on average, 4.33 weeks. This means some months will have four of a particular weekday, while others have five. This seemingly small difference can significantly skew weekly totals.
Quarters Are REALLY Not Equal
Even quarters vary in length, from 90 days in a non-leap Q1 to 92 days in Q3 and Q4. This 2.2% difference can impact quarterly reporting if not properly normalized.
The Math of Recurrence Enumeration
To accurately analyze recurring events, you must first enumerate their exact dates. Here are Python functions to handle common recurrence patterns.
Code for enumerate_weekly, enumerate_biweekly, enumerate_monthly, and enumerate_month_end is included in the image generation script.
Visualizing Recurrence and Seasonality
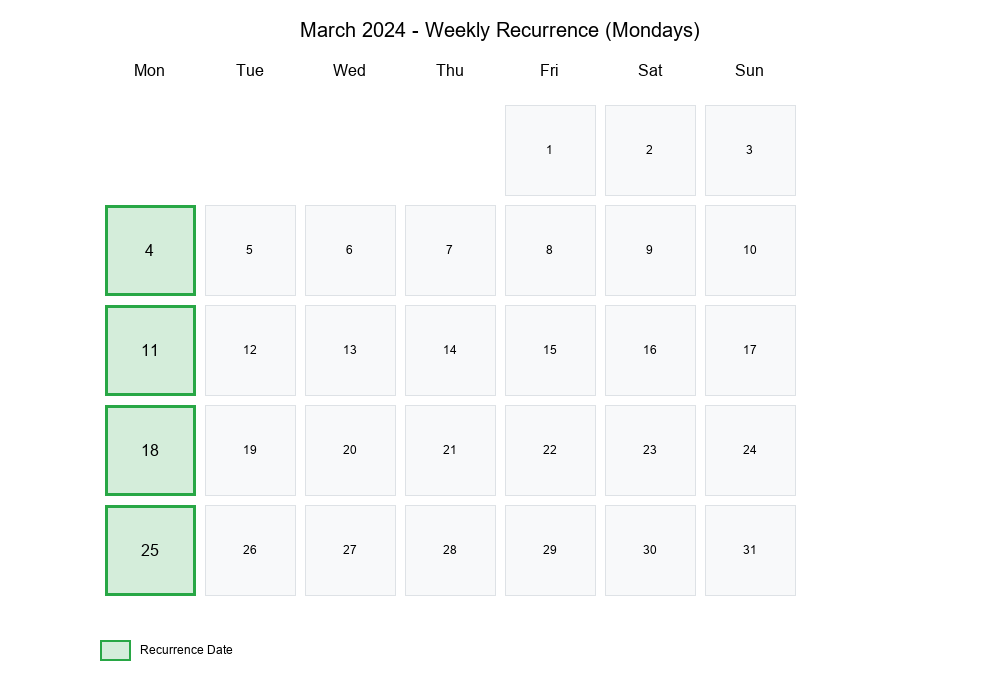
Calendar with Selected Recurrences
A visual calendar makes it easy to see how recurring dates fall within a month. The plot below highlights all Mondays in March 2024, showing that there are exactly four.
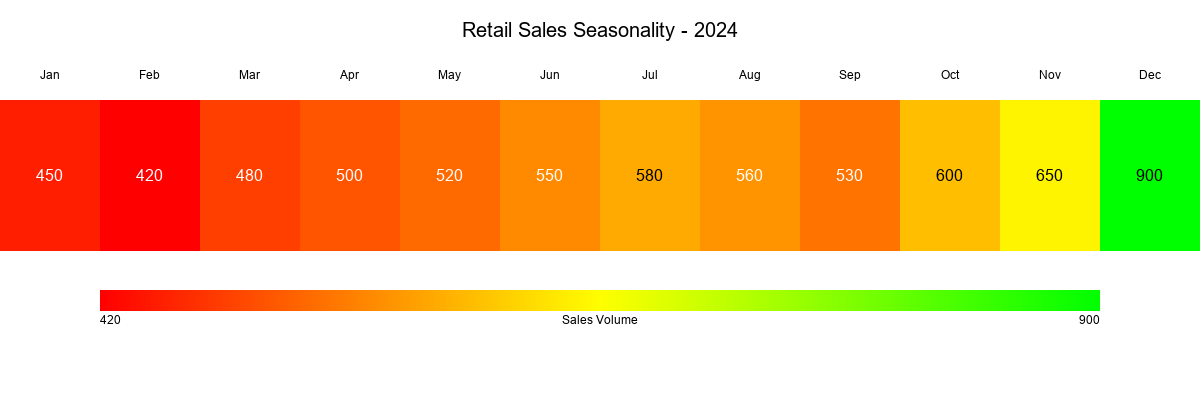
Seasonality Stripes: The Hidden Pattern
Seasonality refers to predictable patterns that repeat over time. A heatmap or "seasonality stripe" plot can reveal these patterns at a glance, such as a holiday sales spike in December.
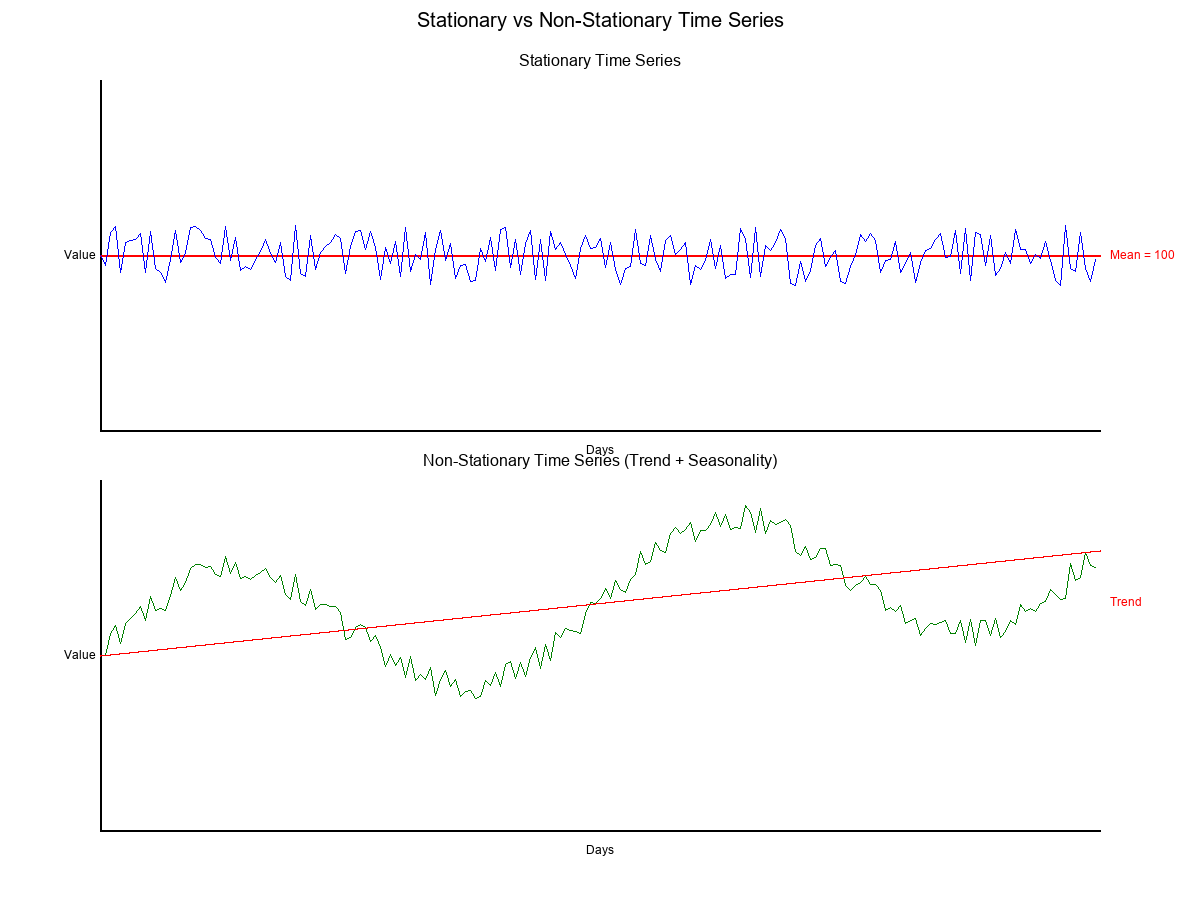
Stationarity Assumptions: When Time Series Break
Stationarity means that the statistical properties of a time series (like mean and variance) do not change over time. Many common statistical models assume stationarity, and they can produce incorrect results when this assumption is violated.
Real-world data, with its trends and seasonal patterns, is rarely stationary.
The Comparison Trap: An Exercise
Comparing different time periods without normalization is a classic trap. A month might look better simply because it's longer or had more weekends.
The Golden Rule: Always normalize by period length before comparing!
- Method 1: Normalize by Days: Compare the daily average.
- Method 2: Same-Length Windows: Compare the first N days of each period.
- Method 3: Deseasonalize: Adjust for historical seasonal patterns before comparing.
Best Practices for Time Comparisons
- Normalize by Period Length: Convert absolute values to daily rates.
- Account for Weekday Mix: If weekends/weekdays behave differently, normalize their composition.
- Use Year-Over-Year Carefully: Account for leap years and shifting weekday patterns.
- Deseasonalize: Remove predictable seasonal effects before comparing performance.
- Document Assumptions: Clearly state which normalization method you used.
Final Thoughts
Time and recurrence math is full of traps, but with the right techniques, you can navigate them. By normalizing periods, accounting for seasonality, and enumerating recurring dates with precision, you can turn messy calendar data into reliable insights.
Your analysis should be timeless, not a victim of time.
Where This Shows Up in Practice
- Data Pipelines: Ensuring high-quality filtering and robust statistical metrics before feeding downstream ML models.
- Production Anomaly Detection: Tracking system logs, performance latencies, or transaction volumes under heavy skew.
- A/B Testing & Evaluation: Correctly partitioning user cohorts or comparing treatment outcomes without normal distribution assumptions.