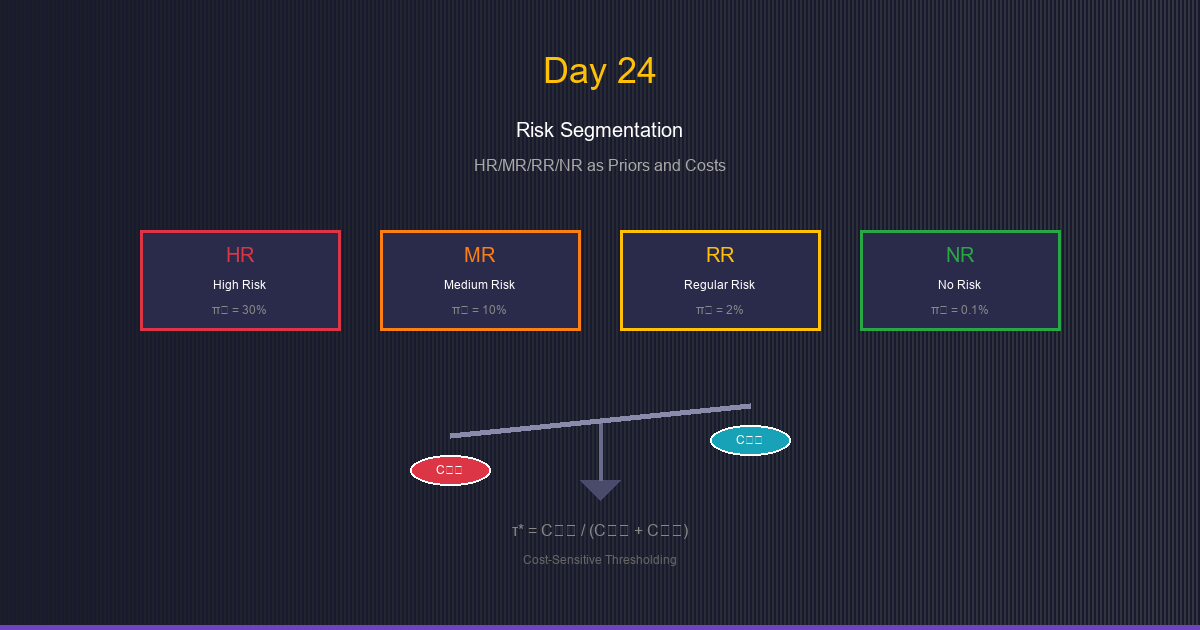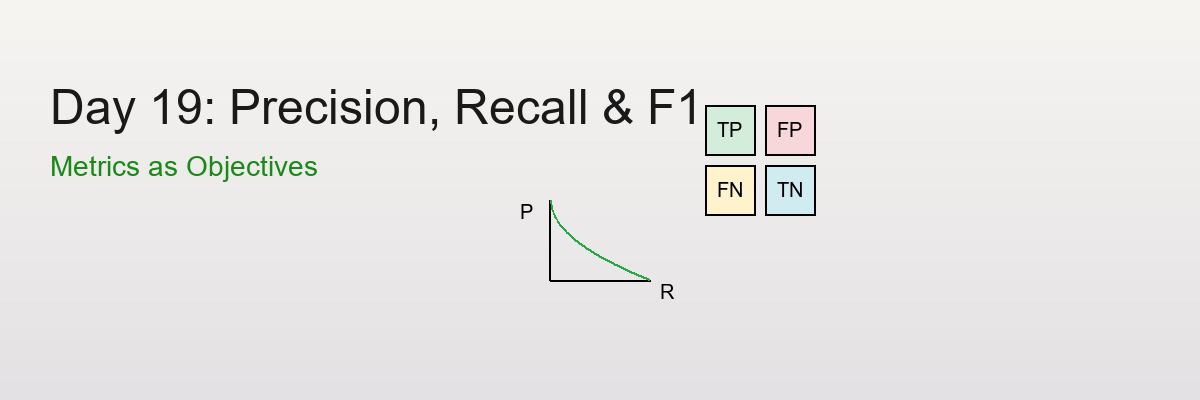
Day 19: Precision, Recall, and F1 as Objectives
Master the fundamental metrics that drive classification decisions. Understand the precision-recall trade-off and learn to optimize for your specific use case.
When building classification models, accuracy alone isn't enough. Precision, Recall, and F1 score reveal the true performance of your model—especially when dealing with imbalanced classes. Learn how to interpret these metrics and optimize thresholds for your specific objectives.
The Problem with Accuracy Alone
Scenario: You're building a fraud detection system.
Total transactions: 10,000
Fraudulent transactions: 100 (1%)
Legitimate transactions: 9,900 (99%)
Naive model: "Always predict legitimate"
Accuracy = 9,900 / 10,000 = 99%
But wait! This model caught zero fraud cases!
The problem: Accuracy is misleading when classes are imbalanced. We need metrics that focus on what matters: finding the positive cases (fraud) and not raising false alarms.
The Confusion Matrix: Foundation of All Metrics
Before we dive into Precision, Recall, and F1, we need to understand the Confusion Matrix—the foundation that makes these metrics possible.
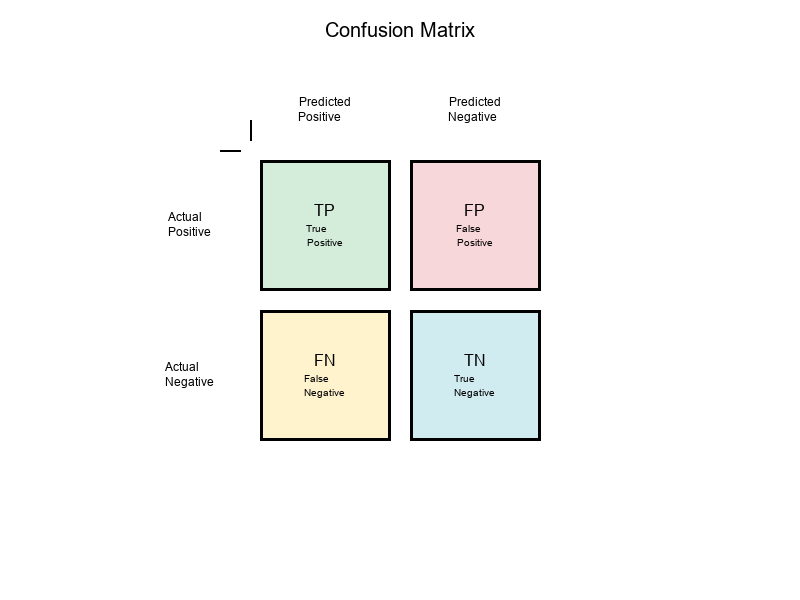
What is a Confusion Matrix?
A confusion matrix is a table that shows how well your model performs by comparing predicted vs actual values:
Predicted
Positive  Negative
Actual Positive    TP       FN
Negative    FP       TN
Key Terms:
- TP (True Positive): Correctly predicted positive cases
- TN (True Negative): Correctly predicted negative cases
- FP (False Positive): Incorrectly predicted as positive (Type I error)
- FN (False Negative): Incorrectly predicted as negative (Type II error)
Visual Example:
Precision: How Accurate Are Your Positive Predictions?
Definition: Precision measures the proportion of positive predictions that are actually correct.
Formula:
Precision = TP / (TP + FP)
Interpretation:
- High Precision: When you predict positive, you're usually right
- Low Precision: Many of your positive predictions are wrong
Example:
Model predictions:
- Predicted 50 fraud cases
- Actually fraudulent: 40
- False alarms: 10

Precision = 40 / (40 + 10) = 40 / 50 = 0.80 = 80%
When to optimize for Precision:
- Cost of false positives is high (e.g., blocking legitimate customers)
- Limited resources to investigate positive predictions
- Spam detection: Better to let some spam through than block legitimate emails
The Precision Question:
"Of all the cases I flagged as positive, how many were actually positive?"
Recall: How Many Positives Did You Find?
Definition: Recall (also called Sensitivity or True Positive Rate) measures the proportion of actual positives that you correctly identified.
Formula:
Recall = TP / (TP + FN)
Interpretation:
- High Recall: You catch most of the positive cases
- Low Recall: You miss many positive cases
Example:
Actual fraud cases: 100
Model found: 80
Missed: 20

Recall = 80 / (80 + 20) = 80 / 100 = 0.80 = 80%
When to optimize for Recall:
- Cost of false negatives is high (e.g., missing cancer diagnosis)
- Finding all positives is critical (e.g., security threats)
- Medical diagnosis: Better to have false alarms than miss real cases
The Recall Question:
"Of all the actual positive cases, how many did I find?"
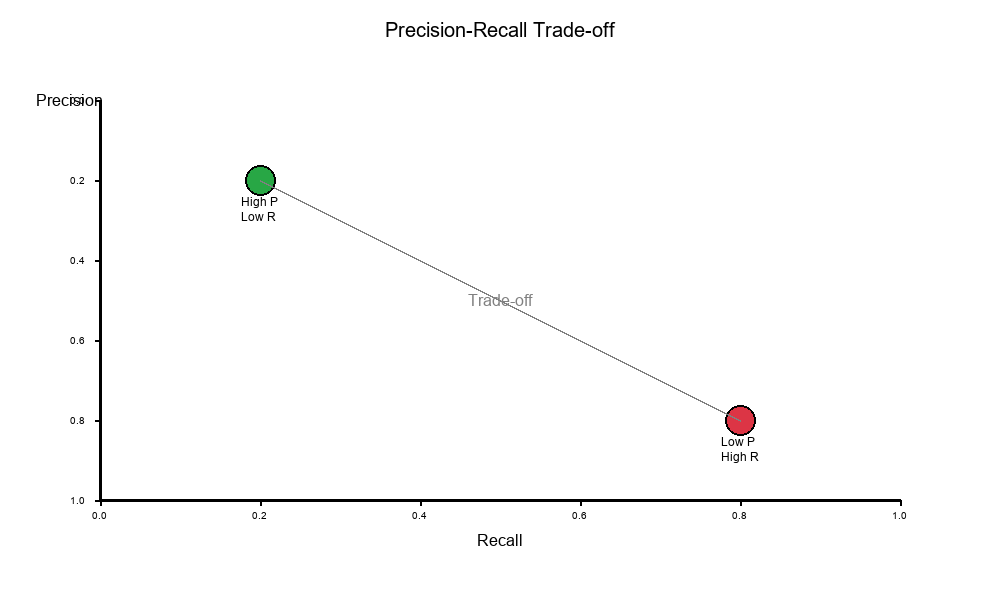
The Precision-Recall Trade-Off
The fundamental tension: You can't maximize both Precision and Recall simultaneously.
Why? Because they measure different things:
- Precision: Quality of your positive predictions
- Recall: Coverage of actual positives
Visual Example:
Common Scenarios:
Scenario 1: High Precision, Low Recall
Precision = 95% (very few false positives)
Recall = 30% (misses 70% of positives)

Use case: Email spam filter
- Better to let some spam through
- Don't want to block important emails
Scenario 2: Low Precision, High Recall
Precision = 40% (many false positives)
Recall = 95% (catches almost all positives)

Use case: Medical screening
- Better to have false alarms
- Can't afford to miss real cases
Scenario 3: Balanced
Precision = 75%
Recall = 75%

Use case: General classification
- Good balance for most applications
F1 Score: The Harmonic Mean
Definition: F1 score is the harmonic mean of Precision and Recall, providing a single metric that balances both.
Formula:
F1 = 2 × (Precision × Recall) / (Precision + Recall)
Why Harmonic Mean?
- Harmonic mean penalizes extreme values
- If either Precision or Recall is low, F1 will be low
- Encourages balanced performance
Example:
Precision = 0.80
Recall = 0.60

F1 = 2 × (0.80 × 0.60) / (0.80 + 0.60)
= 2 × 0.48 / 1.40
= 0.96 / 1.40
= 0.686 ≈ 69%
When to use F1:
- Balanced objective: You care about both Precision and Recall equally
- Class imbalance: F1 is more informative than accuracy
- Comparing models: Single metric for easy comparison
F1 Score Properties:
- Range: 0 to 1 (higher is better)
- F1 = 1: Perfect Precision and Recall
- F1 = 0: Either Precision or Recall is 0
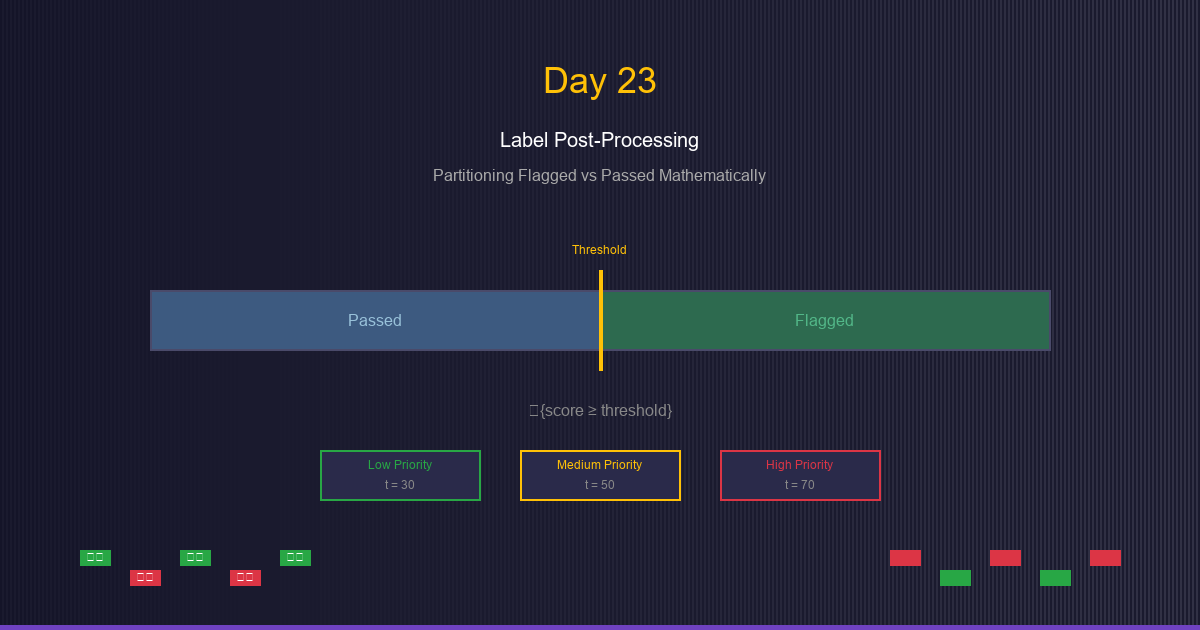
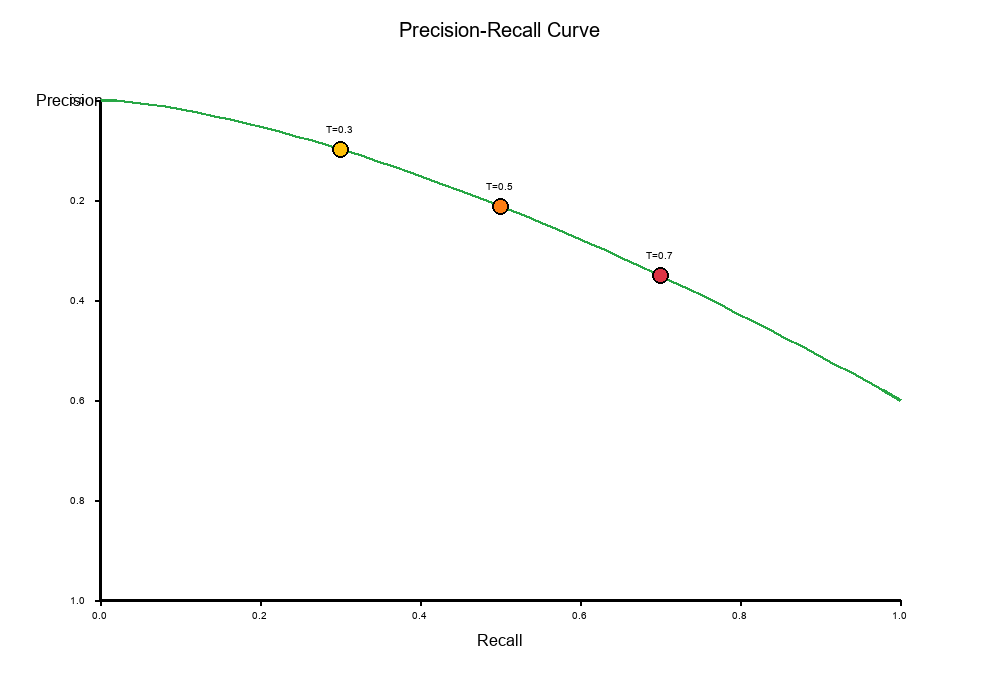
Threshold Selection: Moving the Precision-Recall Curve
Key Insight: Changing the classification threshold moves you along the Precision-Recall curve.
How Thresholds Work
Most classification models output a probability score (0 to 1). You then choose a threshold to convert probabilities to binary predictions:
If probability >= threshold: Predict Positive
If probability < threshold: Predict Negative
Example:
Model outputs probabilities:
- Transaction A: 0.95 → Predict Fraud (high confidence)
- Transaction B: 0.65 → Predict Fraud (medium confidence)
- Transaction C: 0.30 → Predict Legitimate (low confidence)
The Threshold Effect
Low Threshold (e.g., 0.3):
- More positive predictions
- Higher Recall (finds more positives)
- Lower Precision (more false positives)
High Threshold (e.g., 0.8):
- Fewer positive predictions
- Lower Recall (misses more positives)
- Higher Precision (fewer false positives)
Visual Example:
Exercise: Threshold Selection
Let's see how raising a threshold affects Precision and Recall:
Show code (27 lines)
# Example: Fraud detection model
# Lower threshold = more predictions = higher recall, lower precision
# Higher threshold = fewer predictions = lower recall, higher precision

thresholds = [0.1, 0.3, 0.5, 0.7, 0.9]
results = []

for threshold in thresholds:
# Predict positive if probability >= threshold
predictions = (probabilities >= threshold)

# Calculate metrics
tp = sum((predictions == 1) & (actual == 1))
fp = sum((predictions == 1) & (actual == 0))
fn = sum((predictions == 0) & (actual == 1))

precision = tp / (tp + fp) if (tp + fp) > 0 else 0
recall = tp / (tp + fn) if (tp + fn) > 0 else 0
f1 = 2 * (precision * recall) / (precision + recall) if (precision + recall) > 0 else 0

results.append({
'threshold': threshold,
'precision': precision,
'recall': recall,
'f1': f1
})
Expected Pattern:
- As threshold increases → Precision increases, Recall decreases
- As threshold decreases → Precision decreases, Recall increases
- F1 peaks at some intermediate threshold
Class Imbalance Effects: Why Accuracy Fails
The Problem: When classes are imbalanced, accuracy becomes a misleading metric.
Example: Rare Disease Detection
Total patients: 10,000
Disease present: 50 (0.5%)
Disease absent: 9,950 (99.5%)
Model A: Always predict "no disease"
TP = 0, TN = 9,950, FP = 0, FN = 50
Accuracy = (0 + 9,950) / 10,000 = 99.5%
Precision = 0 / (0 + 0) = undefined
Recall = 0 / (0 + 50) = 0%
F1 = 0
Model B: Actually detects disease
TP = 40, TN = 9,900, FP = 50, FN = 10
Accuracy = (40 + 9,900) / 10,000 = 99.4%
Precision = 40 / (40 + 50) = 44.4%
Recall = 40 / (40 + 10) = 80%
F1 = 2 × (0.444 × 0.80) / (0.444 + 0.80) = 57.1%
Key Insight:
- Model A has higher accuracy but is useless (finds no disease)
- Model B has slightly lower accuracy but is actually useful (finds 80% of cases)
Why Precision, Recall, and F1 Matter:
- They focus on the positive class (the rare, important class)
- They reveal model performance that accuracy hides
- They guide threshold selection for imbalanced problems
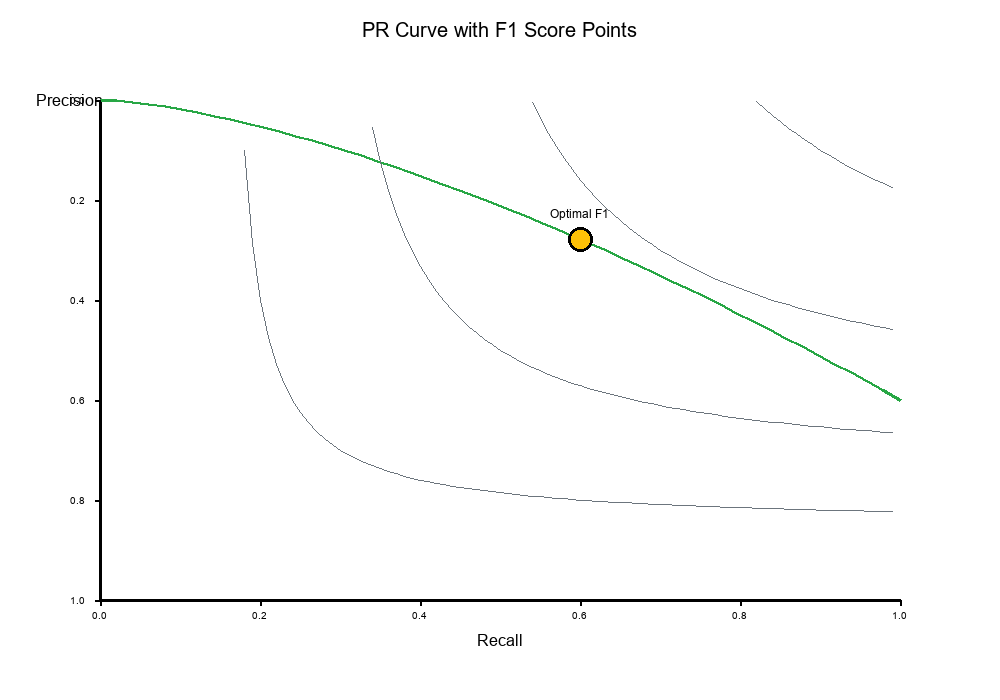
PR Curves vs Single F1 Point
Precision-Recall (PR) Curve
A PR curve plots Precision (y-axis) vs Recall (x-axis) for different threshold values.
What it shows:
- All possible trade-offs between Precision and Recall
- Area Under Curve (AUC-PR): Overall model performance
- Optimal threshold: Point closest to (1, 1) or highest F1
Visual Example:
Single F1 Point
A single F1 score represents one point on the PR curve (at a specific threshold).
Limitations:
- Doesn't show the full trade-off space
- Depends on threshold selection
- May not reflect model's true potential
When to use each:
- PR Curve: Model development, threshold selection, comparing models
- Single F1: Production monitoring, reporting, when threshold is fixed
Real-World Application: Overlay Analysis and Point of Productivity
Overlay Analysis
Concept: Overlay analysis picks thresholds that optimize Precision, Recall, or F1 based on business objectives.
Process:
- Generate PR curve for your model
- Identify business constraints (e.g., max false positive rate)
- Select threshold that maximizes objective within constraints
- Deploy model with selected threshold
Example:
Show code (33 lines)
def overlay_analysis(probabilities, actual, max_fp_rate=0.05):
"""
Find optimal threshold using overlay analysis

Constraints:
- False positive rate <= max_fp_rate
- Maximize F1 score
"""
thresholds = np.linspace(0, 1, 100)
best_threshold = 0.5
best_f1 = 0

for threshold in thresholds:
predictions = (probabilities >= threshold)
tp = sum((predictions == 1) & (actual == 1))
fp = sum((predictions == 1) & (actual == 0))
fn = sum((predictions == 0) & (actual == 1))
tn = sum((predictions == 0) & (actual == 0))

fpr = fp / (fp + tn) if (fp + tn) > 0 else 0

# Check constraint
if fpr <= max_fp_rate:
precision = tp / (tp + fp) if (tp + fp) > 0 else 0
recall = tp / (tp + fn) if (tp + fn) > 0 else 0
f1 = 2 * (precision * recall) / (precision + recall) if (precision + recall) > 0 else 0

if f1 > best_f1:
best_f1 = f1
best_threshold = threshold

return best_threshold, best_f1
Point of Productivity
Concept: Point of Productivity computes per-rule F1 score to identify which rules contribute most to overall performance.
Use Case: Rule-based systems where you want to:
- Identify high-performing rules
- Remove low-performing rules
- Optimize rule combinations
Example:
Show code (23 lines)
def point_of_productivity(rules, predictions, actual):
"""
Compute F1 score for each rule
"""
rule_f1_scores = {}

for rule_name, rule_predictions in rules.items():
tp = sum((rule_predictions == 1) & (actual == 1))
fp = sum((rule_predictions == 1) & (actual == 0))
fn = sum((rule_predictions == 0) & (actual == 1))

precision = tp / (tp + fp) if (tp + fp) > 0 else 0
recall = tp / (tp + fn) if (tp + fn) > 0 else 0
f1 = 2 * (precision * recall) / (precision + recall) if (precision + recall) > 0 else 0

rule_f1_scores[rule_name] = {
'precision': precision,
'recall': recall,
'f1': f1
}

return rule_f1_scores
Best Practices for Using Precision, Recall, and F1
1. Choose Metrics Based on Use Case
High Precision:
- Spam detection
- Content moderation
- Quality control
High Recall:
- Medical diagnosis
- Security threats
- Fraud detection (when cost of missing is high)
Balanced (F1):
- General classification
- When both errors matter equally
2. Always Report Multiple Metrics
Don't rely on a single metric. Report:
- Precision
- Recall
- F1
- Confusion Matrix (for full picture)
3. Use PR Curves for Threshold Selection
- Plot PR curve for your model
- Identify business constraints
- Select threshold that optimizes your objective
- Document your threshold selection rationale
4. Consider Class Imbalance
- Accuracy is misleading with imbalanced classes
- Use Precision, Recall, and F1 instead
- Consider weighted F1 for multi-class problems
5. Monitor Metrics in Production
- Track Precision, Recall, and F1 over time
- Set up alerts for metric degradation
- Retrain when metrics drop below thresholds
Summary Table
| Metric | Formula | Focus | Use When |
|---|---|---|---|
| Precision | TP / (TP + FP) | Quality of positive predictions | False positives are costly |
| Recall | TP / (TP + FN) | Coverage of actual positives | False negatives are costly |
| F1 Score | 2PR / (P + R) | Balance of Precision and Recall | Need balanced performance |
Final Thoughts
Precision, Recall, and F1 are fundamental metrics that reveal the true performance of classification models—especially when dealing with imbalanced classes. Understanding their trade-offs and how threshold selection affects them is crucial for building production ML systems.
Key Takeaways:
Precision measures how accurate your positive predictions are Recall measures how many positives you find F1 balances both metrics Threshold selection moves you along the PR curve Class imbalance makes accuracy misleading—use Precision, Recall, and F1 instead
Your model's performance depends on your objectives. Choose your metrics wisely!