Day 22: Set Theory and Venn Diagrams for Comparisons
The Problem: Measuring Overlap
Scenario: You're comparing two fraud detection models (Model A and Model B).
Questions:
- How many cases did both models catch? (Overlap)
- How many cases did only Model A catch? (Unique to A)
- How many cases did only Model B catch? (Unique to B)
- How similar are the two models? (Similarity metric)
Simple counting isn't enough. You need set theory to answer these questions systematically!
Set Theory Fundamentals: Building Blocks
What is a Set?
A set is a collection of distinct objects (elements).
Examples:
- Set A: All fraud cases detected by Model A =
{case1, case2, case3, ...} - Set B: All fraud cases detected by Model B =
{case2, case3, case5, ...} - Universal Set U: All fraud cases =
{case1, case2, case3, case4, case5, ...}
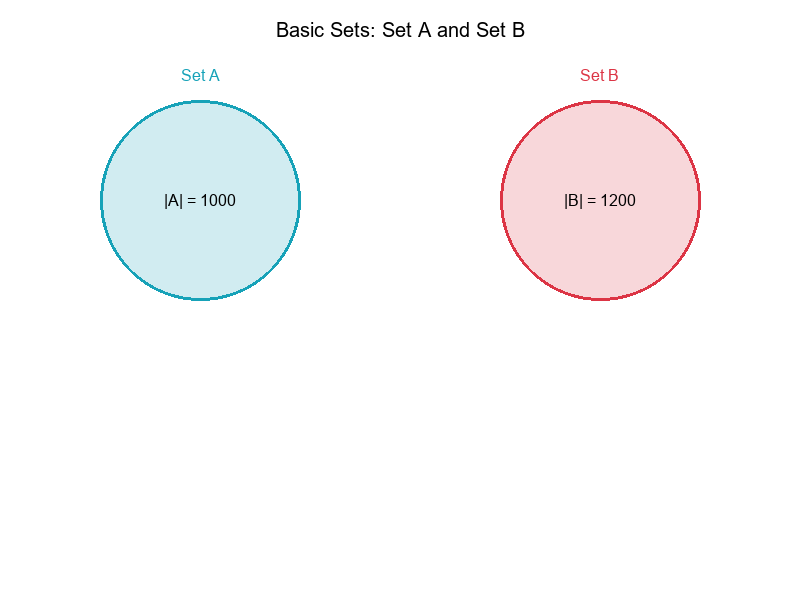
Cardinality
Cardinality is the number of elements in a set.
Notation:
|A|= size of set A (number of elements)|B|= size of set B (number of elements)
Example:
|A| = 1000  (Model A detected 1000 fraud cases)
|B| = 1200  (Model B detected 1200 fraud cases)
Visual Example:
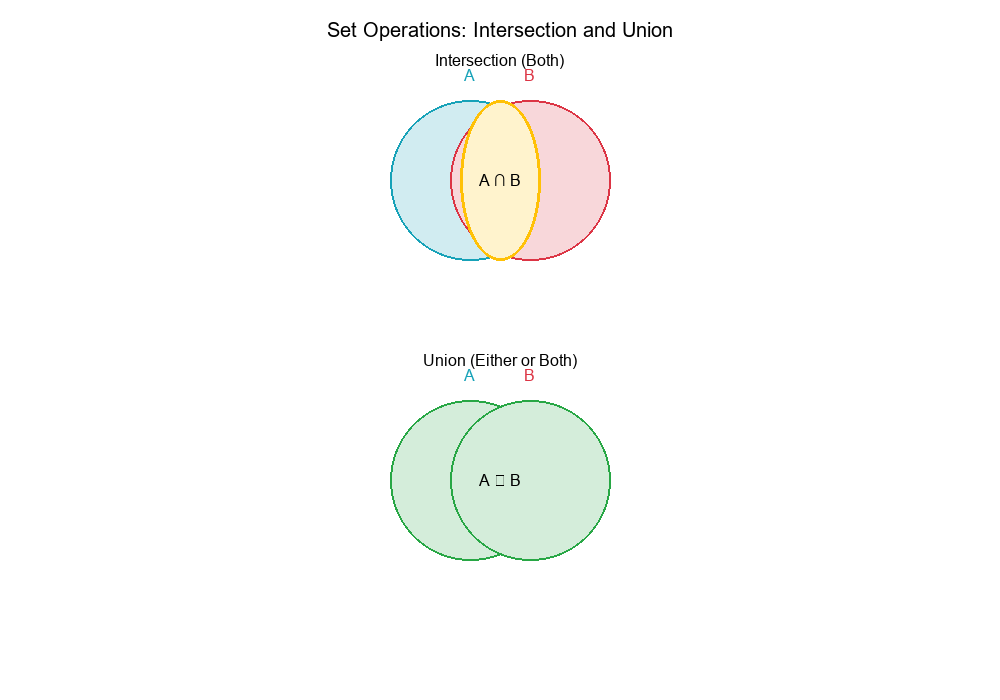
Set Operations: Intersection and Union
Intersection (A ∩ B)
Definition: The intersection of two sets contains elements that are in both sets.
Notation: A ∩ B
Example:
A = {1, 2, 3, 4, 5}
B = {3, 4, 5, 6, 7}
A ∩ B = {3, 4, 5}
Cardinality: |A ∩ B| = number of elements in both sets
Interpretation:
- For fraud detection: Cases caught by both models
- For thresholds: Events captured by both threshold settings
- For versions: Items changed in both versions
Union (A ∪ B)
Definition: The union of two sets contains all elements that are in either set (or both).
Notation: A ∪ B
Example:
A = {1, 2, 3, 4, 5}
B = {3, 4, 5, 6, 7}
A ∪ B = {1, 2, 3, 4, 5, 6, 7}
Cardinality: |A ∪ B| = number of elements in either set
Interpretation:
- For fraud detection: All cases caught by either model
- For thresholds: All events captured by either threshold
- For versions: All items changed in either version
Visual Example:
Inclusion-Exclusion Principle: Computing Union Size
The Formula
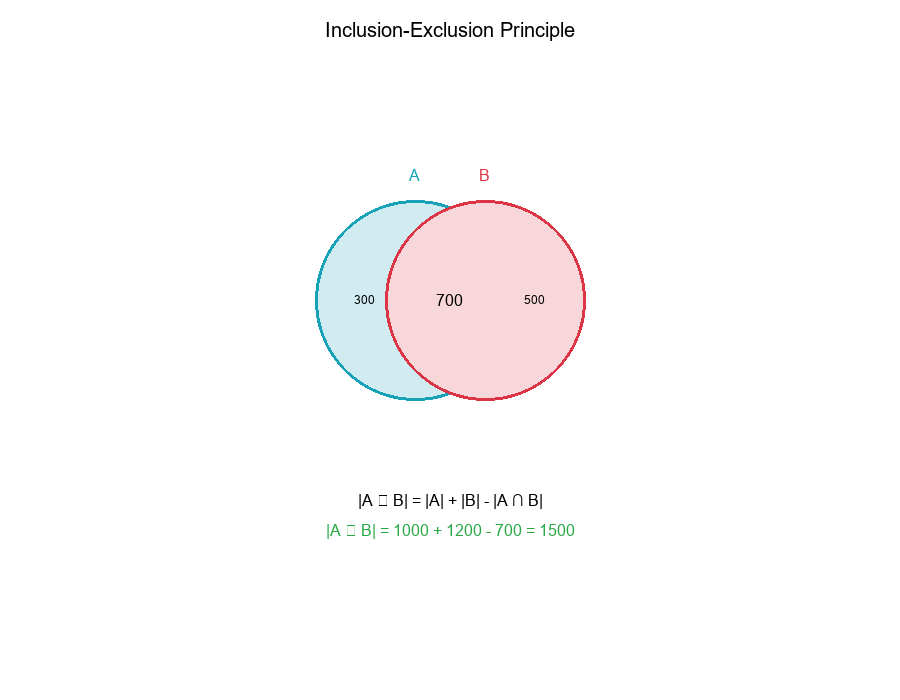
Inclusion-Exclusion Principle:
|A ∪ B| = |A| + |B| - |A ∩ B|
Why subtract the intersection?
- When adding |A| and |B|, elements in the intersection are counted twice
- Subtract |A ∩ B| to correct for the double-counting
Example:
|A| = 1000
|B| = 1200
|A ∩ B| = 700

|A ∪ B| = 1000 + 1200 - 700 = 1500
Interpretation:
- Model A caught 1000 cases
- Model B caught 1200 cases
- Both models caught 700 cases (overlap)
- Total unique cases caught: 1500
Visual Example:
Venn Diagrams: Visualizing Set Relationships
What is a Venn Diagram?
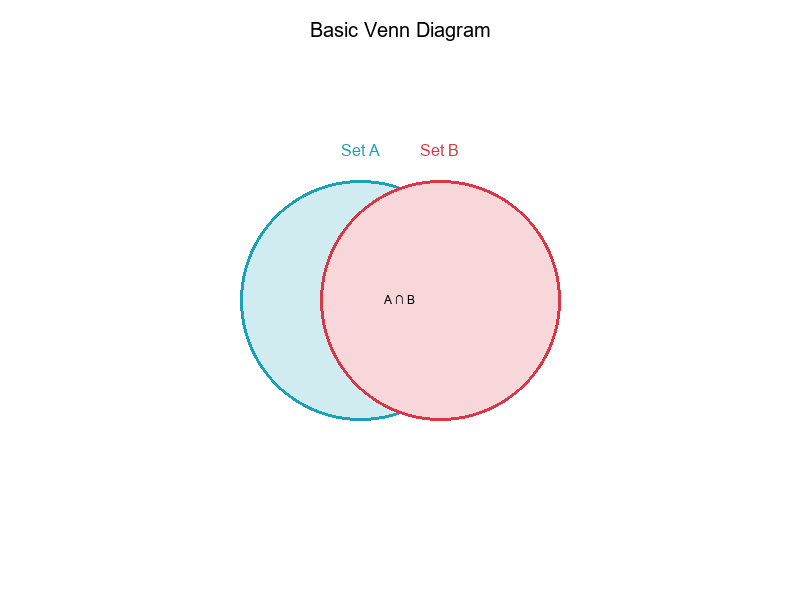
A Venn diagram is a visual representation of set relationships using overlapping circles.
Basic 2-Set Venn Diagram:
- Two circles represent two sets
- Overlap represents intersection
- Non-overlapping regions represent unique elements
Visual Example:
Venn Diagram with Counts
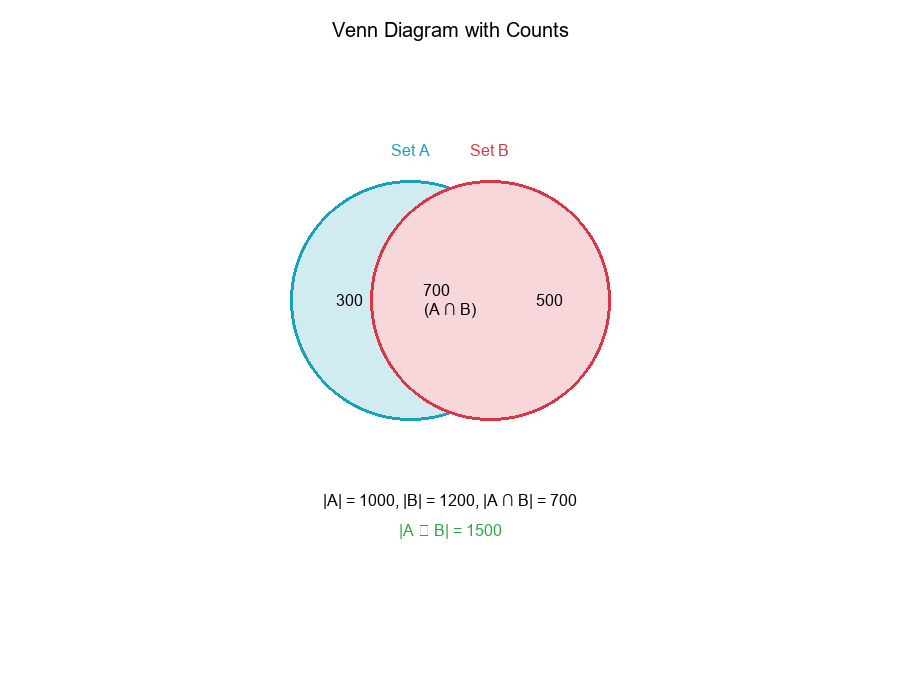
To make Venn diagrams useful, we annotate them with cardinalities (counts):
Example:
Show code (10 lines)
|A| = 1000
|B| = 1200
|A ∩ B| = 700

Venn Diagram Annotations:
- Only A: |A| - |A ∩ B| = 1000 - 700 = 300
- Only B: |B| - |A ∩ B| = 1200 - 700 = 500
- Both (Intersection): |A ∩ B| = 700
- Total (Union): |A ∪ B| = 1500
Visual Example:
Jaccard Index: Measuring Set Similarity
What is the Jaccard Index?
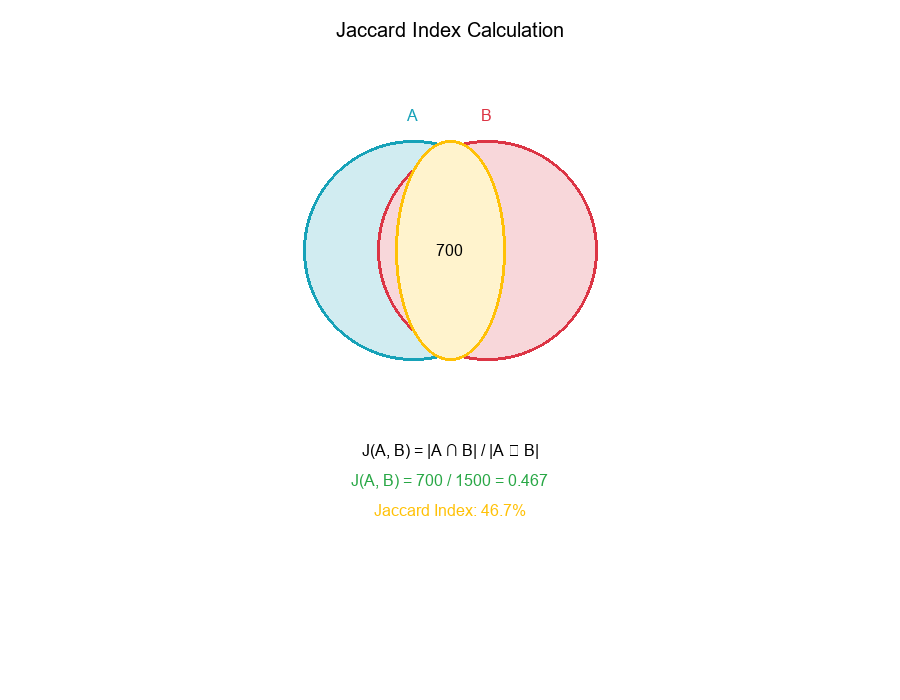
The Jaccard index (also called Jaccard similarity coefficient) measures the similarity between two sets.
Formula:
J(A, B) = |A ∩ B| / |A ∪ B|
Properties:
- Range: 0 to 1
- J = 0: No overlap (disjoint sets)
- J = 1: Complete overlap (identical sets)
- Higher J: More similar sets
Example:
|A| = 1000
|B| = 1200
|A ∩ B| = 700
|A ∪ B| = 1500

J(A, B) = 700 / 1500 = 0.467 ≈ 47%
Interpretation: The two sets share 47% of their combined elements.
Visual Example:
When to Use Jaccard Index
Perfect for:
- Comparing model outputs
- Measuring threshold overlap
- Evaluating version differences
- Clustering similarity
Not ideal for:
- When one set is much larger than the other (skewed towards larger set)
- When absolute counts matter more than ratios
Overlap Coefficient: Alternative Similarity Metric
What is the Overlap Coefficient?
The overlap coefficient (also called Szymkiewicz–Simpson coefficient) measures overlap relative to the smaller set.
Formula:
Overlap(A, B) = |A ∩ B| / min(|A|, |B|)
Properties:
- Range: 0 to 1
- Overlap = 0: No overlap
- Overlap = 1: Smaller set is completely contained in larger set
- More sensitive to the smaller set
Example:
|A| = 1000
|B| = 1200
|A ∩ B| = 700

Overlap(A, B) = 700 / min(1000, 1200) = 700 / 1000 = 0.70 = 70%
Interpretation: 70% of the smaller set (A) is covered by the larger set (B).
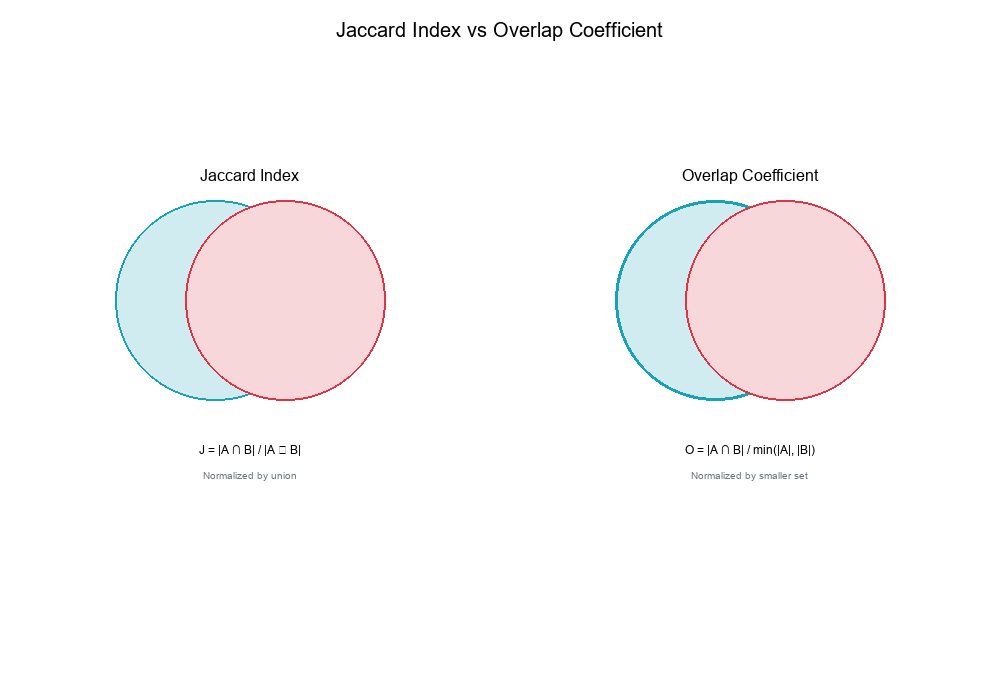
Jaccard vs Overlap Coefficient
Comparison:
|A| = 100
|B| = 1000
|A ∩ B| = 80

Jaccard = 80 / (100 + 1000 - 80) = 80 / 1020 = 0.078 ≈ 8%
Overlap = 80 / min(100, 1000) = 80 / 100 = 0.80 = 80%
Key Difference:
- Jaccard: Normalized by union (both sets matter equally)
- Overlap: Normalized by smaller set (focuses on coverage of smaller set)
When to use each:
- Jaccard: When both sets are equally important
- Overlap: When you care about how much of the smaller set is covered
Visual Example:
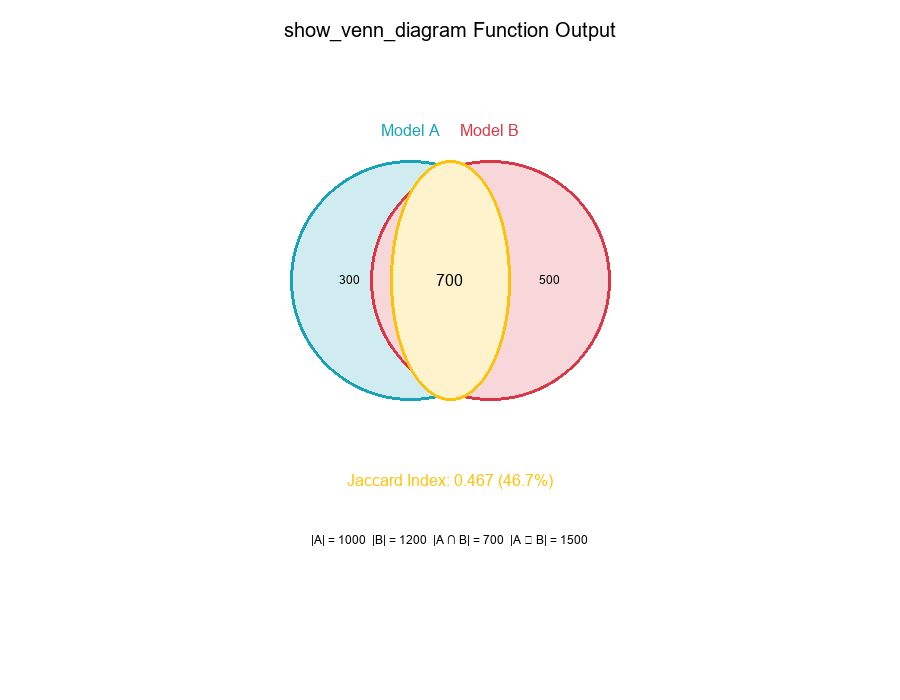
Real-World Application: show_venn_diagram Function
Purpose
The show_venn_diagram function compares "events captured" across threshold sets or versions.
Use Cases:
- Compare fraud cases across two model versions
- Analyze events captured by different thresholds
- Measure overlap between rule sets
- Evaluate classification consistency
Code Concept:
Show code (28 lines)
def show_venn_diagram(set_a, set_b, label_a="Set A", label_b="Set B"):
"""
Visualize overlap between two sets using Venn diagram

Parameters:
- set_a: First set (list or set)
- set_b: Second set (list or set)
- label_a: Label for first set
- label_b: Label for second set

Returns:
- Venn diagram visualization with counts and Jaccard index
"""
# Calculate cardinalities
cardinality_a = len(set_a)
cardinality_b = len(set_b)
intersection = len(set_a & set_b)
union = len(set_a | set_b)

# Calculate Jaccard index
jaccard = intersection / union if union > 0 else 0

# Create Venn diagram
# - Draw two circles
# - Annotate with counts
# - Show Jaccard index
# - Color-code regions
Visual Example:
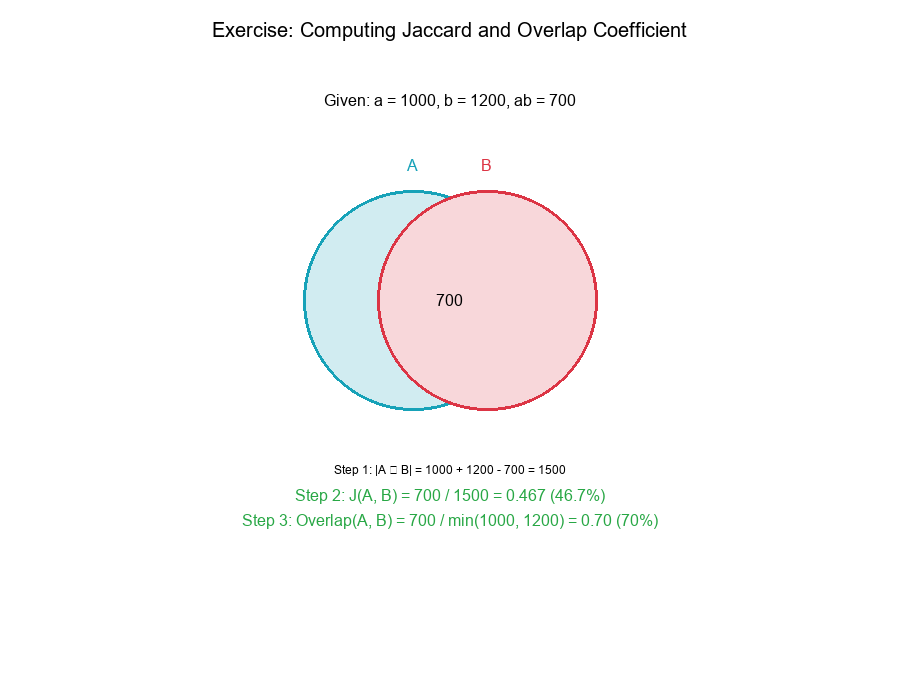
Exercise: Computing Jaccard and Overlap Coefficient
The Problem
Given triplet: (a, b, ab) where:
a= |A| = 1000 (cardinality of set A)b= |B| = 1200 (cardinality of set B)ab= |A ∩ B| = 700 (intersection size)
Compute:
- Jaccard index
- Overlap coefficient
Solution
Step 1: Calculate Union Size
Using inclusion-exclusion principle:
|A ∪ B| = |A| + |B| - |A ∩ B|
= 1000 + 1200 - 700
= 1500
Step 2: Calculate Jaccard Index
J(A, B) = |A ∩ B| / |A ∪ B|
= 700 / 1500
= 0.467
≈ 46.7%
Step 3: Calculate Overlap Coefficient
Overlap(A, B) = |A ∩ B| / min(|A|, |B|)
= 700 / min(1000, 1200)
= 700 / 1000
= 0.70
= 70%
Step 4: Interpret Results
- Jaccard = 46.7%: The two sets share about 47% of their combined elements
- Overlap = 70%: 70% of the smaller set (A) is covered by set B
Visual Example:
Python Implementation
Show code (32 lines)
def compute_similarity_metrics(a, b, ab):
"""
Compute Jaccard index and overlap coefficient

Parameters:
- a: |A| (cardinality of set A)
- b: |B| (cardinality of set B)
- ab: |A ∩ B| (intersection size)

Returns:
- dict with Jaccard and Overlap coefficients
"""
# Calculate union
union = a + b - ab

# Calculate Jaccard index
jaccard = ab / union if union > 0 else 0

# Calculate overlap coefficient
overlap = ab / min(a, b) if min(a, b) > 0 else 0

return {
'jaccard': jaccard,
'overlap': overlap,
'union': union
}

# Example usage
result = compute_similarity_metrics(a=1000, b=1200, ab=700)
print(f"Jaccard Index: {result['jaccard']:.3f} ({result['jaccard']*100:.1f}%)")
print(f"Overlap Coefficient: {result['overlap']:.3f} ({result['overlap']*100:.1f}%)")
Output:
Jaccard Index: 0.467 (46.7%)
Overlap Coefficient: 0.700 (70.0%)
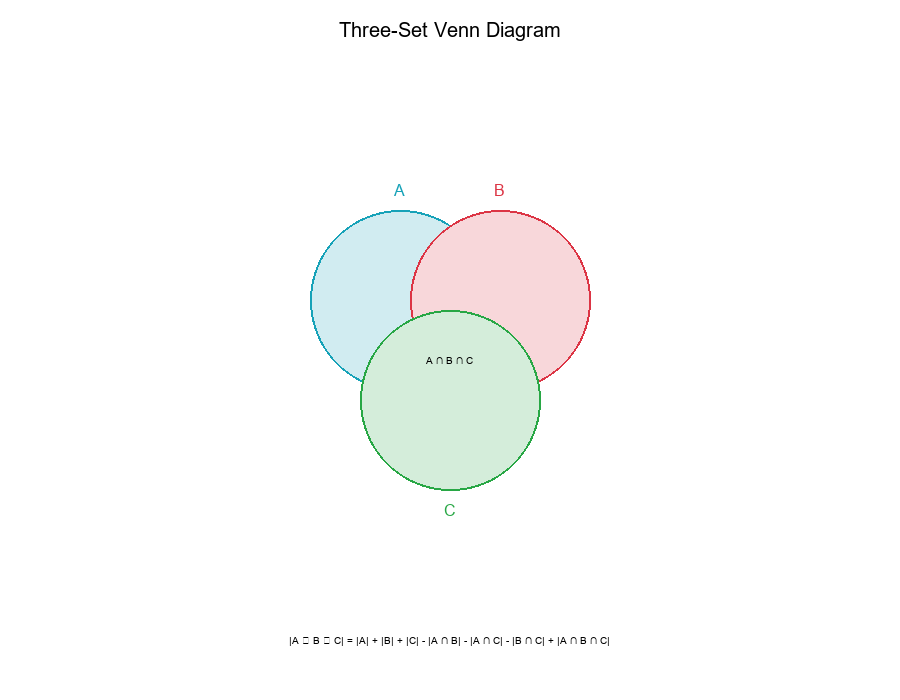
Advanced: Three-Set Venn Diagrams
Three Sets
When comparing three sets (A, B, C), the relationships become more complex:
Regions:
- Only A:
A - (B ∪ C) - Only B:
B - (A ∪ C) - Only C:
C - (A ∪ B) - A and B (not C):
(A ∩ B) - C - A and C (not B):
(A ∩ C) - B - B and C (not A):
(B ∩ C) - A - All three:
A ∩ B ∩ C
Inclusion-Exclusion for Three Sets:
|A ∪ B ∪ C| = |A| + |B| + |C|
- |A ∩ B| - |A ∩ C| - |B ∩ C|
+ |A ∩ B ∩ C|
Visual Example:
Best Practices for Set Comparison Analysis
1. Always Annotate Venn Diagrams
Include cardinalities for:
- Each set
- Intersections
- Unique regions
- Total union
2. Calculate Multiple Metrics
Don't rely on a single metric. Calculate:
- Jaccard index
- Overlap coefficient
- Absolute counts
- Relative percentages
3. Visualize Before Analyzing
Always create a Venn diagram to:
- Understand relationships visually
- Spot patterns quickly
- Communicate findings effectively
4. Consider Set Sizes
Be aware of:
- Size differences between sets
- Impact on similarity metrics
- Whether absolute or relative measures matter
5. Use Appropriate Metrics
Choose metrics based on your question:
- Jaccard: When both sets matter equally
- Overlap: When smaller set coverage matters
- Absolute counts: When volumes are critical
6. Document Your Sets Clearly
For each set, document:
- What it represents
- How it was created
- When it was captured
- Any filters applied
Summary Table
| Concept | Notation | Formula | Use Case |
|---|---|---|---|
| Cardinality | |A| | Number of elements | Set size |
| Intersection | A ∩ B | Elements in both sets | Overlap measurement |
| Union | A ∪ B | All elements in either set | Combined coverage |
| Inclusion-Exclusion | |A ∪ B| | |A| + |B| - |A ∩ B| | Union calculation |
| Jaccard Index | J(A, B) | |A ∩ B| / |A ∪ B| | Normalized similarity (0-1) |
| Overlap Coefficient | Overlap(A, B) | |A ∩ B| / min(|A|, |B|) | Smaller set coverage (0-1) |
Final Thoughts
Set theory and Venn diagrams are powerful tools for understanding relationships between sets. They help you visualize overlaps, calculate similarity metrics, and make informed decisions when comparing versions, thresholds, or classifications.
Key Takeaways:
Cardinality measures set size Intersection identifies overlap Union captures combined coverage Inclusion-Exclusion calculates union size Jaccard index measures normalized similarity Overlap coefficient measures smaller set coverage Venn diagrams visualize relationships intuitively
Visualize your sets to understand your data!